Expertise:
Beginner
How do I actually do this?
Here is a Matlab statement that smooths the height curves that we have
already computed by penalizing the total curvature of the fourth derivative.
hgtffd = smooth_fd(hgtffd, 0.01, int2Lfd(4));
The third argument specifies that it is the fourth derivative that we want to
control. The second argument is a small constant that multiplies the roughness
measure. The closer this constant is to zero, the less penalty is applied to
roughness. The larger this constant is, the more roughness will be penalized,
and ultimately we will have a curve with zero fourth derivative. Such a curve
will be a third degree polynomial. Here we are applying a fairly light penalty
to roughness.
Figure 2 repeats Figure 1 of the previous example (See
From Raw Data to Functional Data - Page 2). Perhaps at first we don't see much difference,
and after all an error of about three millimeters is hard to see in a plot like
this. But we do see in the title that the average residual is now 0.3
centimeters, which seems about right. In fact, this is how we chose
the roughness penalty; we experimented with different values until
we achieved this level of fit.
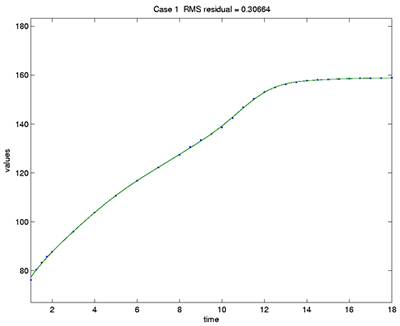
Figure 2: The height of the first girl in the Berkeley Growth Study.
Dots indicate the ages at which measurements were taken. The fitted
curve has a typical error of
about 0.3 centimeters, and is a result
of penalizing roughness at the level of the fourth derivative.
|