Expertise:
Beginner
How can I best represent my functional data?
We're interested in how temperatures fluctuate at each weather station
over an entire year. Although the temperatures change slowly and
continuously over time, we only have discrete observations sampled
from this process. This is often the case with functional data.
Yet FDA sees each curve as a distinct observation or datum in itself.
So we'd like to use the given data
to represent the continuous temperature process at each weather station with a smooth curve - that
is, to build a functional data object from the observations. (See
the human growth example
for more information on how building a functional object is done.)
The functional data objects for the thirty-five weather stations
are displayed here, figure 1, with the same color codes. The discrete
data points are put aside, and we now work with these estimated curves.
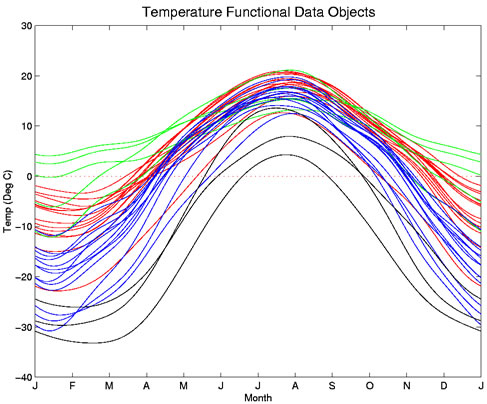
Figure 1: Smooth curves fitting the raw data for mean monthly temperatures at
thirty-five Canadian weather stations. Data for
Atlantic stations are plotted
in red, Continental in blue, Pacific in green, and Arctic in black.
|