Expertise:
Intermediate
What is the Index?
The index of nondurable goods manufacturing for the United States, plotted
in Figure 1, monitors the production of goods that wear out within two years,
such as food, tobacco, clothing, paper products, fuels, and utilities. Because
such items are, in normal times, repeatedly purchased, the index reflects the
economy of everyday life. When times are good, people exhibit strong and
stable spending patterns, but shocks such as the collapse of the stock market in
1929 and the onset of World War II produce both short-lived transitory effects
and longer-lasting readjustments of lifestyles. Technical innovations such as the
development of the personal computer in the early 1980s affect both consumer
habits and the production process itself.
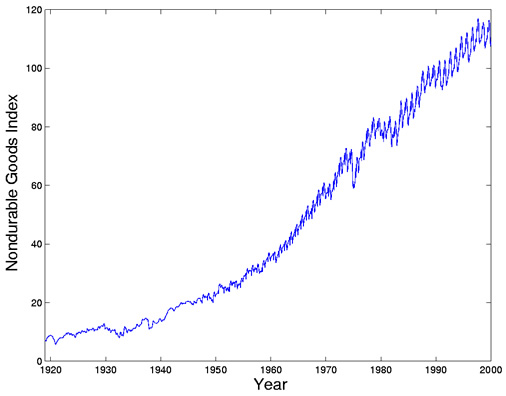
Figure 1:Monthly nondurable goods manufacturing for the United States over
the period 1919 to 2000.
In this and most economic indicators, there is a multilayered structure.
There are overall trends that span a century or more, and we see in Figure
1 that there is a broad tendency for exponential or geometric increase. Longterm
changes last decades, medium term effects such as recessions last a number of years,
and short-term shocks such as the beginning and end of wars are over in a year or two.
The ripples in Figure 1 indicate an important seasonal variation in the index.
The index includes gift items, so there is a surge in the index in the last part
of each year, followed by a low period in January and February. The beginning
of the school year requires new clothes, and we expect to see another surge
in the preceding months. On the supply side, though, we need people in the
manufacturing process, and vacation periods such as the summer holidays will
necessarily have an impact on factory activities.
This seasonal variation is also affected by changes in the economy at various
time scales, and so we also want to study how the within-year variation
evolves. Perhaps the evolution of seasonal variation can tell us something interesting
about how the economy evolves in normal times, and how it reacts to
times of crisis and structural change. How did the outbreak of World War II
change the seasonal pattern? What about the moving off-shore of a great deal
of manufacturing in recent decades? However, Figure 1 covers too long a time
span to reveal much, and we will need to consider some new ways of plotting
the seasonal trend.
|