Expertise:
Beginner
What are these Data about?
Here we see the change in temperature over the course of a year,
taken from thirty-five weather stations across Canada. Each data
point, marked with an 'x', represents the mean temperature recorded by a
weather station for the entire month, collected over 30 years. The
colors correspond to the geographic climates of the stations.
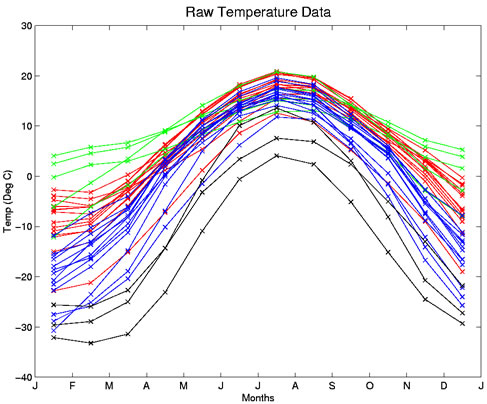
Figure 1: Raw data for mean monthly temperatures at thirty-five Canadian weather stations. Data for
Atlantic stations are plotted in red, Continental in blue, Pacific in green, and Arctic in black.
What Questions Can we Ask of the Data?
Climatologists may have specific scientific hypotheses about temperature data such as these. For example:
What's the typical weather pattern for a Canadian city? For a city on the Pacific coast? In the
Arctic region? What months have the most variable weather across Canada? The most similar weather? Are the summer temperatures just a mirror image of the winter temperatures? That is, are the
weather patterns balanced in the length of seasons and in their intensity? Or do some cities
tend to have extreme temperatures that last for a long time? How do the shapes of the weather patterns differ among the Pacific, Continental, Atlantic, and
Arctic climates? How does the weather pattern in say, Montreal, differ from the typical pattern
in the rest of the Atlantic cities?
Statisticians, on the other hand, will have different questions to ask of the data. For example:
How can I represent the temperature pattern of a Canadian city over the entire year instead of just
looking at the twelve discrete points? Should I just "connect the dots," or is there a better way
to do this? Do the summary statistics "mean" and "covariance" have any meaning when I'm dealing with
curves? How can I determine the primary modes of variation in the data? How many typical modes can
summarize these thirty-five curves? Do these curves exhibit strictly sinusoidal behavior? Can I create an analysis of variance (ANOVA) or linear model with the curves as the response
and the climate as the main effect?
|