Expertise:
Advanced
Can I see an example?
Let's set ourselves a challenge. The data are measurements of the length of
the tibia of a newly born baby on each of its first 39 days. Figure 1 shows a
staircase pattern that is almost impossible to fit monotonically by usual methods
without badly missing the measured values. We have to have monotonicity,
though, in order to get a sensible estimate of velocity.
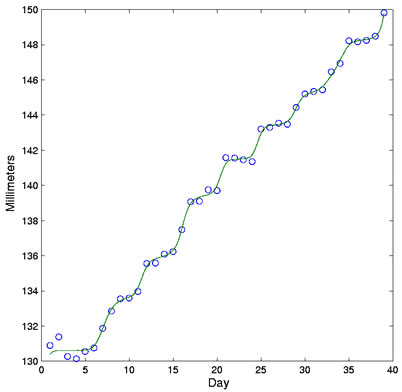
Figure 1: The dots indicate lengths of the tibia in the lower leg of a newborn
infant, and the solid curve is a smooth monotone estimate of height.
First we need to specify the basis for representing function W(t), and we
elected use a B-spline basis with a knot at each day. The roughness of the
second derivative was controlled by a penalty parameter of 0.0001. The following
commands set up the basis, carry out the monotone smoothing, and evaluate
the fitting function and its first derivative at a fine mesh of points:
basis = create_bspline_basis([1,39], 39+2);
Wfd0 = fd(zeros(nbasis,1), basis);
[Wfd, beta] = smooth_monotone(x, y, ones(39,1), Wfd0, 2, 1e-4);
xfine = linspace(1,39,151)';
yhat = beta(1) + beta(2).*eval_mon(xfine,Wfd);
Dyhat = beta(2).*eval_mon(xfine, Wfd, 1);
The growth velocity is shown in Figure 2, and we see an impressive regularity
in these growth spurts, plus the rather astonishing peak values of nearly
two millimeters per day.
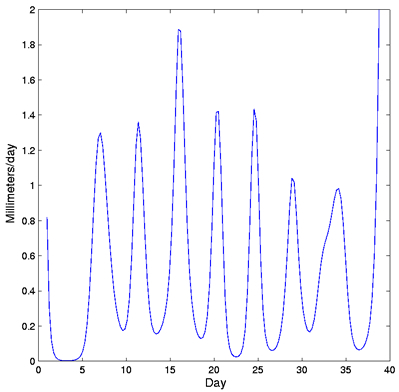
Figure 2: The first derivative or growth velocity curve for the smooth monotone
estimate of height for the newborn baby in Figure 1.
|