Home Examples Learning More FAQ Bibliography Glossary Conferences Software Resources

Basis
Functions

Goods

Growth

-Introduction
-Figure 1
-Figure 2
-Conclusion

Weather

Valid XHTML 1.0!

The Features of Human Growth Data
Previous - 1 - 2 - 3 - 4 - Next: Conclusion

Expertise: Beginner

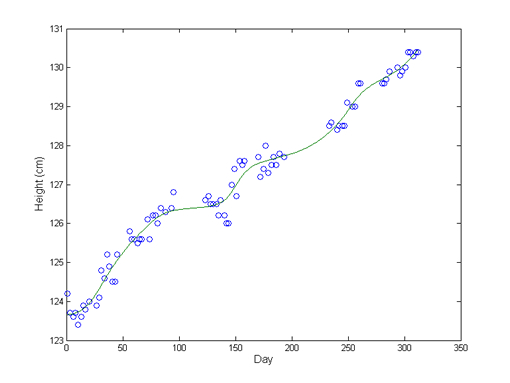
Figure 2 zooms in on growth by using measurements of a boy's height at 83 days over one school year, with gaps corresponding to the school vacations. The measurement noise in the data, of standard deviation about 3 mm, is apparent. The trend is also noticeably more bumpy, with height increasing more rapidly over some weeks than others.


Figure 2: The circles are 83 measurements of height of a 10-year-old boy
The solid curve is a smooth monotone fit to the data, as described
in the example Monotone Smoothing of the Growth Data.

Previous - 1 - 2 - 3 - 4 - Next: Conclusion