Expertise:
Intermediate
The Mid 70's: A time of Structural Change
Three years in which important changes occur are 1974 to 1976, plotted in
Figure 7. The Vietnam War was concluded in this period, and the OPEC oil
crisis also contributed to a change in economic patterns. One consequence was
the decrease in the size of the fall loop. What we cannot see in this small time
window, though, is that fundamental changes initiated in the mid-1970s persist
to the present day.
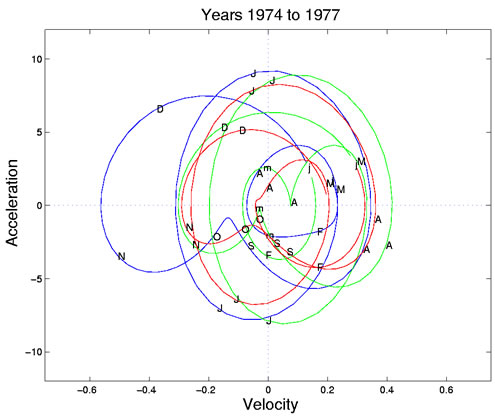
Figure 7: Phase-plane plots for 1974 to 1976, when the production cycles are changing
rapidly. The three years are plotted in blue, green, and red, respectively.
What is happening now? Figure 8 shows that the production cycles are now
much smaller than they once were. We still see fairly large seasonal oscillations,
but they are now much smoother, and hence show less variation in velocity and
acceleration.
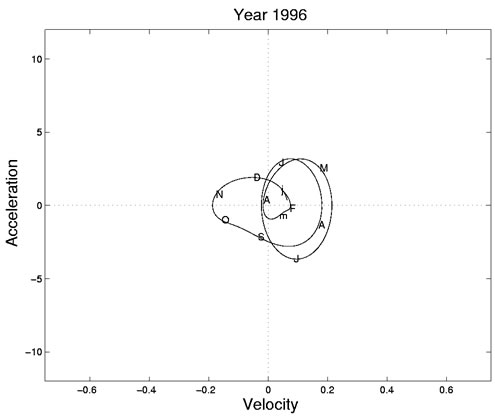
Figure 8: Phase-plane plots for 1996 to 1998, showing the greatly reduced
variability of current production cycles.
Are this loss of dynamism and these structural changes due to the fact that
production is no longer so dependent on manpower? Or, perhaps, that it is
more tightly controlled by information technology? On the other hand, it may
be simply that far more nondurable goods are now manufactured outside the
United States.
A further clue to recent changes is that in the early 1990s, personal computers
and other electronic goods were classified as durable. Consequently, one
sees in the comparable index for durable goods a strong increase in its typical
slope at that point. Although it is true that electronic goods usually last more
than two years, the pace of technological development in this sector has meant
that, effectively, consumers have tended to discard these items within two years
because they become obsolete. This loss of electronic goods in the nondurable
goods index has surely diminished its energy.
Another important trend is the movement of a great deal of the nondurable
goods production offshore. Until relatively recently, it was mostly durable goods
that were manufactured abroad, but now we move much more of our raw materials
to places where labour is cheap and then bring them back again for consumption.
|