|
|
Welcome to the Functional Data Analysis Website!
Functional data analysis, which lots of us like to call "FDA", is about the
analysis of information on curves or functions. For example, these twenty
traces of the writing of "fda" are curves in two ways: first, as static traces
on the page that you see after the writing is finished, and second, as two
sets functions of time, one for the horizontal "X" coordinate,
and the other for the vertical "Y" coordinate.

FDA is a collection statistical techniques for answering questions like, "What are the main ways in
which the curves vary from one writing to another?" In fact, most of the questions and problems associated with the
usual multivariate data analyzed by statistical packages like SAS and SPSS have their functional counterparts.
But what is unique about functional data is the possibility of also using information on the rates of change or derivatives
of the curves. We use slopes, curvatures, and other characteristics made available because these curves are intrinsically smooth,
and we can use this information in many useful ways. For example, our high school physics tells us that force = mass times
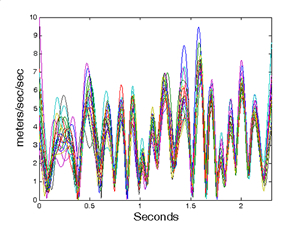
acceleration, and that suggests that we look at the acceleration or second derivative of the pen's position as a function of time.
What we see in the plot of the magnitudes of the acceleration vector is that acceleration hits nearly ten meters/second/second.
That's a lot of energy! Equally remarkable is the stability of these acceleration records from one trial to the next. Also, note
that where the acceleration magnitudes are near zero, both the X and Y accelerations must simultaneously be zero.
The brain seems to know what it's doing!
In this website you can:
- Learn more about FDA
- See several examples of FDA at work on real data
- Find out about technical issues at various levels of expertise
- Download software in Matlab, R, or S-PLUS that will enable you to do your own FDA's
- Read an annotated list of references where you can learn more
Notice the menus on the top and left side of the screen (below is a rotated copy). The left menu changes depending on the item you choose on the top menu. Where appropriate, you will see left menu choices in three colors:
|
| ||||||||||||||||||||||
- GREEN for beginners with only basic knowledge of statistics and little or no previous exposure to FDA
- BLUE for intermediate levels of expertise, involve more knowledge of both mathematics and statistics (such as knowing what a derivative is), and perhaps more acquaintance with FDA
- BLACK for experts, fully functioning functional data analysts with relatively advanced issues on their minds