Expertise:
Intermediate
Plotting the Depression and World War II
With this basic pattern characterizing the phase-plane plot for a stable year,
it can be revealing to examine years in which important events took place.
Figure 4 shows what happened in 1929 to 1931. Year 1929 has roughly the
same features as we saw above for 1964, but we see a bulge to the left in the late
autumn, when the stock market crashed. By November of that year production
was in a state of free fall. We pick up the story in the middle cycle for 1930, and
see that, after a small spring and larger summer cycle, the autumn cycle loses
much of its potential energy, and this is even more evident in 1931. Probably
this is attributable to the collapse of consumer demand in the holiday period as
people restrict spending to the essentials.
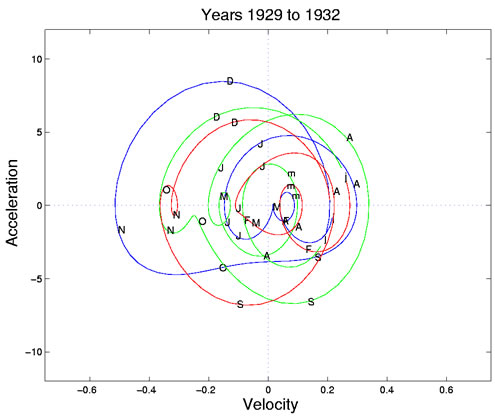
Figure 4: Phase-plane plots for the years 1929 to 1931, during the onset of the Depression.
The horizontal and vertical scale is the same as in Figure 3. The three years
are plotted in blue, green, and red, respectively.
Figure 5 pictures the events leading to World War II. The first part of 1937
shows only small amounts of energy as the Depression continues. But the cycle
is dramatically altered in the fall by the sudden decrease in the money supply
imposed by the Treasury Board when it feared that the economy might be overheated
and headed for another crash. This precipitous event was comparable in
size to the stock market crash of 1929, but even more sudden. The spring and
fall cycles were all but wiped out in 1938.
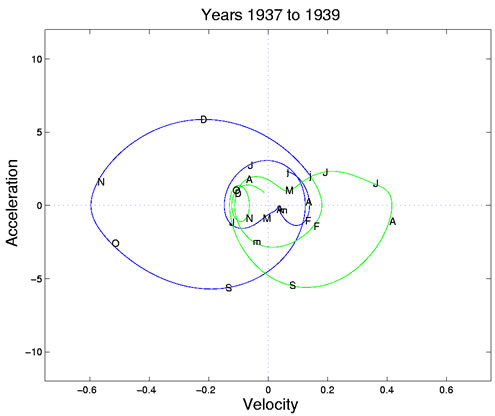
Figure 5: Phase-plane plots for the two years preceding the Second World War.
The years are plotted in blue and green, respectively.
Figure 6 shows the reduced seasonal variability during the war years. In
times of war people don't take holidays, make do with what they have, and spend
less at Christmas. Moreover, war production did not exhibit much seasonal
variation since the demand for nondurable goods, like the war itself, was steady
through the year.
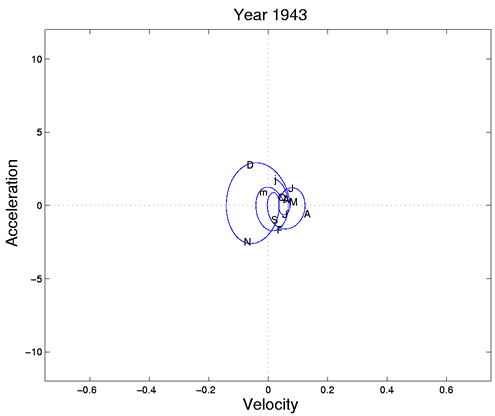
Figure 6: Phase-plane plot for a typical year in the Second World War.
|