|
The Features of Human Growth Data | |
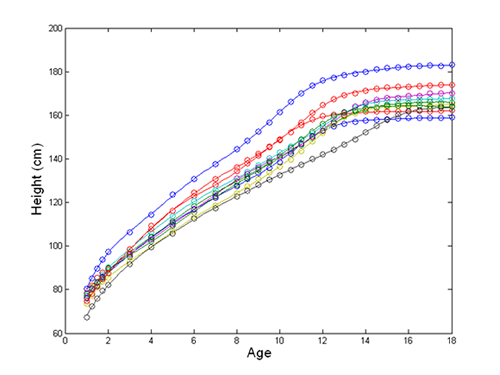
Expertise: Beginner Figure 1 shows, for each of 10 girls, the height function H(t) as estimated from 31 observations taken between 1 and 18 years. Note that the times of measurement are not equally spaced. These data were collected as part of the Berkeley Growth Study. Growth is the most rapid in the earliest years, but we note the increase in slope during the pubertal growth spurt (PGS) that occurs at ages ranging from about 9 to 15 years. One girl is tall for all ages, but some girls can be tall during childhood, but end up with a comparatively small adult stature. The intervals between height measurements are six months or more, and the picture from this long-term perspective is of a relatively smooth growth process.
| |