|
Smoothing the Nondurable Goods Index | |
Expertise: Intermediate
A first look at the seasonal variation
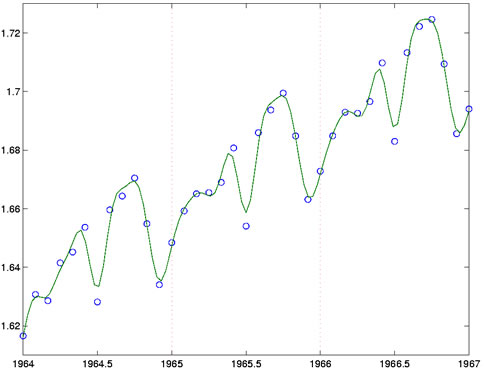
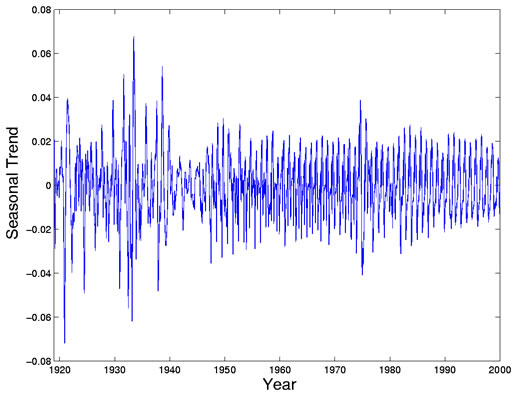
In order to look more closely at seasonal variation, it is desirable to first estimate the long-term nonseasonal trend. The straight line in the plot of the log index is too crude; we need to estimate the finer scale wiggles in the curve without trying to track variation within each year. To do this, we return to spline smoothing, but this time place a knot at each year, and smooth with order 4 splines. This fit does not have the resolving power to show much curvature within any twelve-month period. We then subtract this long-term trend from the fit to the data computed above to get a better view of the strictly seasonal variation. This is shown in Figure 2.
Now we can see that the major events of the century are also reflected in the seasonal trend. Seasonal variation balloons to 6% during the depression, and again around the Treasury Board closure of the money supply, but drops to its lowest level during World War II. The sixties are a remarkably orderly period, but the end of the Vietnam War first shows up as increased variability, and then in the following years as decreased stability. The size of seasonal variation seems to be on the decrease in recent years. | |